

NOTE: This spreadsheet is for the use of knowledgeable professionals, capable of evaluating the accuracy of the results. The author is not responsible for the use to which these results are put.
1 The 'Cyclone size' sheet calculates dimensions for various standard cyclones.
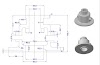
Enter the flow rate, design inlet velocity and gas density in the colored squares and the sheet will give dimensions for five standard cyclones - two high efficiency, and three low efficiency. The table also gives the predicted pressure drop, but be aware that this is a very uncertain calculation (see original references). See 'Diagram' sheet for nomenclature.
On the 'Cyclone size' sheet you specify the units you want to use - metric or US Customary (Imperial)
THIS UNITS SELECTION APPLIES TO ALL SHEETS
2 Two methods are provided for calculating cyclone efficiency. You can calculate both, and compare the results on the chart. Both sheets are set up with the same layout, so data can be copied between sheets easily.
3 The efficiency calculation requires particle size data, cyclone dimensions, and physical property data for the gas and the solids. The calculation assumes that the size distribution of the particles is log normally distributed. The sheet is set up so that you can enter either the mean and standard deviation of the log normal distribution, or the particle size data, from which these data are then calculated.

4 Procedure for efficiency calculations:
a) Enter the cyclone dimensions in cells D4 to D11. If you have calculated these using this spreadsheet, the values in cells 13 to 20 for the selected cyclone design can be directly copied into D4 to D11. NOTE: Paste special the values - do not just copy the cells.
b) Enter the gas property data in cells D18 to D21.
c) Enter the particulate data in cells D26 to D29. If you enter the mean and standard deviation, and select 'N' for cell D28, then the overall efficiency is immediately given in cell H15, and the inlet and outlet size distributions are given in cells O21 to O41 and R21 to R41.
d) If you want to use the size distribution method, enter 'Y' in cell D28, and then the range limits starting in cell N50 and the corresponding % in range starting in O50. If you want to use more than nine ranges, you can extend these columns to as many rows as you want - just remember to copy the formulae in columns M and P through T into any rows that you add. After entering the size distribution data, You have to run the regression tool. Choose the 'Tools' menu then 'Data Analysis' then 'Regression'. For the 'X' value pick all the values in column Q, starting in Q50; for the 'Y' values, pick all the values in column T, starting in T50. For the 'Output range' enter V48. You will get a message saying results will overwrite cells - pick OK.
Once the regression is done, the results are available, as described in c) above.
5 The chart sheet graphs the penetration (col P = 1 - fractional efficiency) against particle size for the two efficiency calculation methods. CAUTION: The two efficiency sheets are not linked, so make sure they are both calculating from the same data if you want to compare the two efficiency calculations!
6 The spreadsheet is protected in order to prevent accidental overwriting of the formulae.
However, there is no password needed to unprotect it, so you can freely adapt it to suit your purposes.
Direct download from password 1236

From industrial dust collection to separating sand from gravel, cyclones play a vital role in various applications. But how do these swirling giants efficiently separate particles from a gas stream? This article delves into the world of cyclone design and analysis, equipping you with the knowledge to understand, evaluate, and potentially design your own cyclone.
The Core Principle: Centrifugal Separation
At the heart of every cyclone lies a simple principle: centrifugal force. As a gas-particle mixture enters the cyclone tangentially at the top, it's forced into a downward spiral due to the cyclone's conical shape. This creates a spinning vortex, hurling heavier particles outwards towards the wall due to their greater inertia. As they reach the wall, they lose momentum and fall downward into the dust hopper. The cleaner gas, meanwhile, spirals upwards and exits through the central outlet at the top.
Key Design Elements:
Several critical elements influence a cyclone's performance:
- Diameter: Larger diameters generally handle higher flow rates but may compromise separation efficiency for finer particles.
- Cone angle: Steeper angles promote stronger centrifugal forces but can increase pressure drop.
- Inlet design: Tangential inlets create strong swirling motion, while vaned inlets improve efficiency for specific particle sizes.
- Vortex finder: This regulates the core size, influencing pressure drop and separation efficiency.
- Dust hopper: Its size and shape impact dust removal efficiency and prevent re-entrainment into the gas stream.
Understanding Performance Parameters:
Analyzing a cyclone's performance involves evaluating various parameters:
- Collection efficiency: The percentage of particles captured by the cyclone, crucial for specific applications.
- Pressure drop: The pressure difference between the inlet and outlet, impacting fan selection and energy consumption.
- Cut size: The particle size at which the collection efficiency is 50%, indicating the cyclone's effectiveness for specific particle ranges.
Analysis Tools and Techniques:
Several approaches help analyze cyclone performance:
- Empirical correlations: These provide quick estimates based on geometric parameters but may not be highly accurate.
- Computational Fluid Dynamics (CFD): This advanced technique simulates the gas flow and particle trajectories within the cyclone, offering detailed insights but requiring specialized software and expertise.
- Experimental testing: Building and testing a physical cyclone prototype provides real-world data but can be time-consuming and expensive.
Optimizing Design and Performance:
Optimizing a cyclone involves balancing various factors:
- Matching design parameters to desired performance goals.
- Considering trade-offs between efficiency, pressure drop, and cost.
- Utilizing appropriate analysis tools based on project needs and resources.
Additional Considerations:
- Material selection: Cyclones are often made from steel or stainless steel for durability and corrosion resistance.
- Abrasion resistance: Consider lining the cyclone for applications with highly abrasive particles.
- Maintenance: Regular cleaning and inspection are crucial for optimal performance.
Conclusion:
Cyclone design and analysis involve understanding fundamental principles, key design elements, performance parameters, and analysis tools. By carefully considering these aspects, you can design or select a cyclone that effectively meets your specific needs, ensuring efficient separation and optimal performance in your application.
Remember: This article provides a foundational understanding. For more in-depth knowledge and design guidance, consult specialized resources and seek advice from qualified professionals.


)
0 Comments